If you’re preparing for the IELTS Academic exam, understanding the difference between an overview and a conclusion in Writing Task 1 could be the difference between a Band 6 and a Band 7 or higher. This distinction is one of the most misunderstood aspects of the test, yet it’s absolutely critical for success. You can watch this YouTube video explainer by IELTS Guide Phil.
Understanding the Fundamental Difference
What is an Overview?
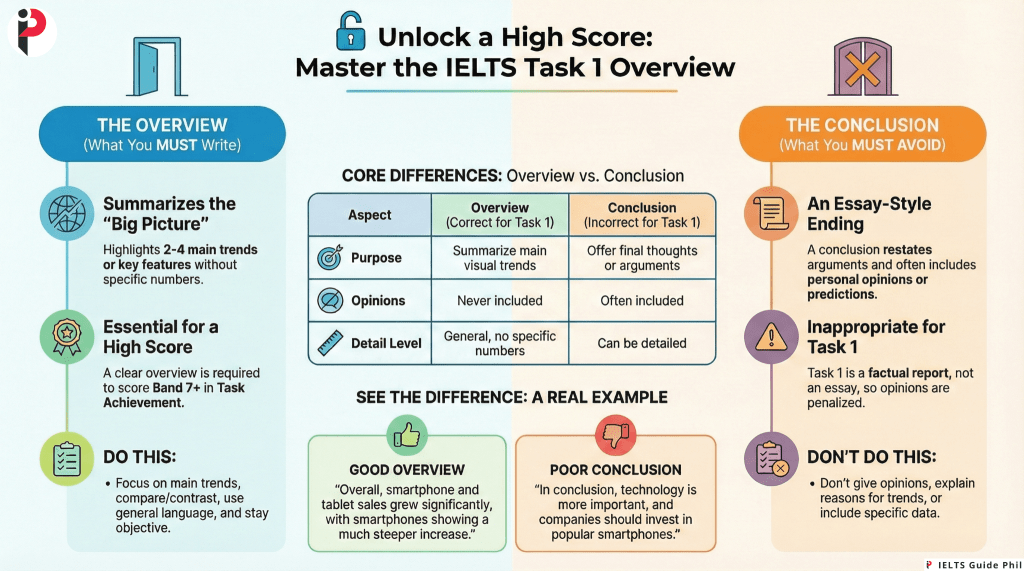
An overview is a summary of the main trends, key features, or most significant patterns visible in the visual data (graph, chart, table, diagram, or map). It provides a bird’s-eye view of what the data shows without going into specific details or numbers.
The overview answers the question: “What are the most noticeable features or trends in this data?”
What is a Conclusion?
A conclusion, on the other hand, is what you write at the end of an essay or argument. It typically:
- Restates the main thesis or argument
- Summarizes points already made
- Offers final thoughts or recommendations
- May include personal opinions or predictions
Why Task 1 Needs an Overview, Not a Conclusion
IELTS Writing Task 1 is a report, not an essay. You are being tested on your ability to:
- Select and report main features
- Make comparisons where relevant
- Present information objectively
- Organize information logically
You are NOT being asked to:
- Give your opinion
- Draw conclusions about why trends occurred
- Make recommendations
- Speculate about future trends (unless the data shows future projections)
The task instructions explicitly state: “Summarise the information by selecting and reporting the main features, and make comparisons where relevant.”
The IELTS Band Descriptors and the Overview
According to the official IELTS band descriptors for Task Achievement (25% of your score), to achieve Band 7 or higher, you must:
Band 7: Present a clear overview of main trends, differences, or stages
Band 6: Present an overview with some information inappropriately selected
Band 5: Recounts detail mechanically with no clear overview
Notice the word “overview” appears explicitly in the descriptors. The absence of a clear overview will cap your Task Achievement score at Band 5, regardless of how well-written the rest of your report is.
Where Should the Overview Go?
You have two options, both equally acceptable:
Option 1: After the Introduction (Recommended)
This is the most common and often clearest structure:
- Introduction (paraphrase the question)
- Overview (main trends/features)
- Body Paragraph 1 (specific details)
- Body Paragraph 2 (specific details)
Option 2: At the End
Some test-takers prefer to place the overview as the final paragraph:
- Introduction
- Body Paragraph 1 (specific details)
- Body Paragraph 2 (specific details)
- Overview (main trends/features)
Both approaches work, but placing the overview early (after the introduction) gives examiners immediate evidence that you understand what’s being asked.
How to Write an Effective Overview
Key Principles
- Keep it general – No specific data, numbers, or percentages
- Highlight 2-4 main features – Don’t try to mention everything
- Make it standalone – Someone reading only your overview should understand the big picture
- Use appropriate language – “Overall,” “In general,” “It is clear that,” “The main trend shows that”
Example 1: Line Graph
Data: A line graph showing smartphone and tablet sales from 2010 to 2020, with smartphone sales rising from 20 million to 180 million, and tablet sales rising from 5 million to 40 million.
Good Overview: “Overall, both smartphone and tablet sales experienced significant growth over the period, with smartphones showing a much steeper increase and maintaining substantially higher sales figures throughout.”
Poor Conclusion (what NOT to write): “In conclusion, we can see that technology is becoming more important in our lives, and companies should continue investing in smartphones because they are more popular than tablets.”
Example 2: Bar Chart
Data: A bar chart comparing the percentage of men and women in different professions (teaching: 35% men, 65% women; engineering: 85% men, 15% women; nursing: 10% men, 90% women; law: 55% men, 45% women).
Good Overview: “Overall, significant gender disparities exist across the professions shown, with nursing and teaching being female-dominated, engineering being male-dominated, and law showing the most balanced distribution between genders.”
Poor Conclusion (what NOT to write): “In conclusion, these statistics prove that gender discrimination exists in the workplace and governments should take action to create more equality in all professions.”
Example 3: Process Diagram
Data: A diagram showing how chocolate is made from cocoa beans through six stages: harvesting, fermenting, drying, roasting, grinding, and molding.
Good Overview: “Overall, the chocolate production process involves six distinct stages, beginning with the harvesting of cocoa beans and culminating in the molding of the final chocolate product.”
Poor Conclusion (what NOT to write): “In conclusion, making chocolate is a complex process that requires careful attention at each stage, and this is why quality chocolate is expensive.”
Dos and Don’ts
DO:
✓ Write your overview in 2-3 sentences
✓ Focus on the most striking or significant features
✓ Compare and contrast the main trends
✓ Use general descriptive language
✓ Make your overview visible and distinct (separate paragraph)
✓ Keep it factual and objective
✓ Use overview signal phrases: “Overall,” “In summary,” “In general,” “It is clear/apparent that”
DON’T:
✗ Include specific numbers, percentages, or dates
✗ Mention every single feature or category
✗ Give opinions or explanations for why trends occurred
✗ Make predictions beyond what the data shows
✗ Use conclusion language: “In conclusion,” “To conclude,” “To sum up”
✗ Include recommendations or suggestions
✗ Repeat the introduction
✗ Omit the overview entirely
Common Mistakes and How to Fix Them
Mistake 1: Including Too Much Detail in the Overview
Wrong: “Overall, in 2010 smartphone sales were 20 million and rose to 50 million in 2012, then to 95 million in 2015, and finally reached 180 million in 2020, while tablets went from 5 million to 40 million.”
Fixed: “Overall, both product categories experienced substantial growth throughout the period, with smartphone sales showing a significantly steeper upward trend than tablet sales.”
Mistake 2: Writing a Conclusion Instead of an Overview
Wrong: “In conclusion, based on the data presented above, it can be said that people prefer smartphones to tablets, and this trend will probably continue in the future because smartphones are more convenient.”
Fixed: “Overall, smartphone sales consistently exceeded tablet sales and demonstrated more dramatic growth over the timeframe shown.”
Mistake 3: No Overview at All
Wrong: Simply jumping from the introduction directly into detailed description of data points without identifying main trends.
Fixed: Always include a separate overview paragraph that identifies 2-4 main features before (or after) discussing specific details.
Mistake 4: Overview Too Similar to Introduction
Wrong: Introduction: “The graph shows smartphone and tablet sales between 2010 and 2020.” Overview: “Overall, the graph displays information about smartphone and tablet sales from 2010 to 2020.”
Fixed: Introduction: “The line graph illustrates the sales figures for smartphones and tablets over a ten-year period from 2010 to 2020.” Overview: “Overall, both product categories experienced significant growth, with smartphone sales demonstrating a steeper upward trajectory and maintaining substantially higher figures throughout the period.”
Mistake 5: Making It Too Vague
Wrong: “Overall, there were some changes in the data shown, with some categories going up and others going down.”
Fixed: “Overall, while renewable energy sources increased their market share substantially, fossil fuel usage declined correspondingly, with solar power showing the most dramatic growth among renewables.”
Quick Comparison Table
| Aspect | Overview | Conclusion |
|---|---|---|
| Purpose | Summarize main visual trends | Summarize arguments/offer final thoughts |
| Detail Level | General, no specific numbers | Can be detailed |
| Opinions | Never | Often included |
| Used In | Reports, descriptions | Essays, arguments |
| IELTS Task 1 | Required | Inappropriate |
| IELTS Task 2 | Not used | Required |
Practice Exercise
Look at this data and identify which is the better overview:
Data: A table showing the percentage of households with internet access in four countries (UK: 60% in 2000, 95% in 2020; USA: 55% in 2000, 90% in 2020; Japan: 40% in 2000, 92% in 2020; India: 5% in 2000, 45% in 2020).
Option A: “In conclusion, internet access has become essential in the modern world, and governments should invest more in digital infrastructure to ensure everyone can access online services.”
Option B: “Overall, all four countries experienced substantial increases in household internet access over the period, with developed nations achieving near-universal coverage while India, despite showing impressive growth, remained comparatively lower.”
Answer: Option B is the correct overview. It identifies main trends (all increased), makes comparisons (developed nations vs. India), and remains objective without specific numbers. Option A is a conclusion with opinions and recommendations, which is inappropriate for Task 1.
Frequently Asked Questions
Q1: Can I use “In conclusion” for my overview?
A: No. Use phrases like “Overall,” “In general,” “It is clear that,” or “The data shows that” instead. “In conclusion” signals the end of an argumentative essay, not a factual report.
Q2: How long should my overview be?
A: Typically 2-3 sentences or about 40-60 words. It should be substantial enough to capture main features but concise enough to remain a summary.
Q3: Do I need an overview for every type of Task 1 (graphs, maps, processes)?
A: Yes. Every Task 1 requires an overview, whether it’s a graph, chart, table, map, or process diagram. The overview simply describes different things (trends for graphs, main changes for maps, main stages for processes).
Q4: Can I score Band 7 without an overview?
A: No. The band descriptors explicitly require a clear overview for Band 7 and above in Task Achievement. Without it, your Task Achievement score will be capped at Band 5, which significantly impacts your overall Writing score.
Q5: Should I include numbers in my overview?
A: No. The overview should be general. Save specific figures, percentages, and dates for your detailed body paragraphs.
Q6: What if the examiner disagrees with what I identify as main features?
A: As long as your identified features are genuinely significant and visible in the data, examiners will accept reasonable variation. The key is that you’ve identified something clearly important, not minor details.
Q7: Can my overview be just one sentence?
A: While technically possible for very simple data, one sentence is usually insufficient to capture multiple main features. Aim for 2-3 sentences to adequately summarize the key trends or features.
Q8: Is it okay to start my overview with “To summarize”?
A: “To summarize” is acceptable but less common than “Overall” or “In general.” It’s not wrong, but some examiners might find it slightly conclusive in tone. Stick with “Overall” for safety.
Final Tips for Success
- Practice identifying main features – Before you start writing, spend 2-3 minutes analyzing the visual and noting the 2-4 most obvious trends or features.
- Make it a habit – Always write an overview in every practice task. This builds muscle memory for the exam.
- Check model answers – Study high-scoring Task 1 samples to see how experienced writers craft their overviews.
- Don’t overthink it – The main features are usually obvious. If you find yourself struggling, you might be making it too complicated.
- Review your work – Before submitting, quickly check: “Does my overview summarize the big picture without specific details or opinions?” If yes, you’re on track.
Conclusion for This Blog Post
Understanding the distinction between an overview and a conclusion in IELTS Writing Task 1 is non-negotiable for achieving your target band score. Remember: you’re writing a factual report, not an argumentative essay. Your overview should capture the main visual trends objectively, without specific data, opinions, or recommendations. Master this element, and you’ll be well on your way to a higher Writing score.
Start incorporating clear, well-structured overviews in all your practice tasks today, and watch your Task Achievement scores improve.
#IELTSWriting #IELTSTask1 #IELTSPreparation #IELTSTips #IELTSAcademic #IELTSOverview #IELTSBand7 #IELTSBand8 #EnglishExam #TestPreparation #AcademicWriting #IELTSStudy #IELTSHelp #IELTSExam #IELTSSuccess #WritingSkills #EnglishLearning #IELTSStrategy #StudyAbroad #IELTSCoaching #IELTSGuidePhil

Leave a comment